Average length of marriage 2026: US, UK, Canada, Australia
US first-divorce medians are about 13–14 years, not 8. Compare current marriages (~20 years) with UK, Canada and Australia.
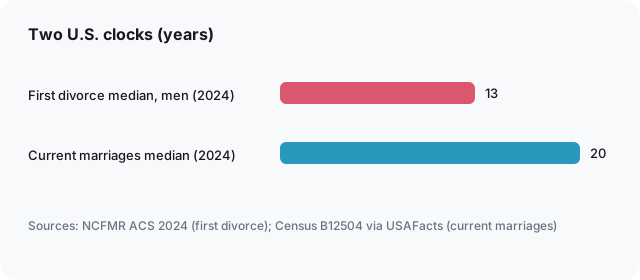
If you have seen the claim that the average length of marriage in the United States is about eight years, you have encountered one of the most persistent myths about divorce. The measured reality is longer: in 2024, the median duration of a first marriage at divorce was 13 years for men and 14 years for women, according to Census Bureau American Community Survey data analyzed by NCFMR. Marriages still intact last longer still: a median of about 20 years as of 2024 (Census Bureau table B12504, via USAFacts).
Key takeaways
- ~20 years: median duration of current, still-intact U.S. marriages as of 2024 (Census B12504 via USAFacts)
- 13.0 years: median duration of opposite-sex marriage at divorce in England and Wales in 2025, the longest since the series began in 1963 (ONS)
- 13.4 years: median duration from marriage to divorce in Australia in 2025 (ABS)
- 12.8 years: median duration of marriage at divorce in Canada in 2020, the latest year in the published series (Statistics Canada)
- 12 years (2023): median length of U.S. marriages that end in divorce, up from 10 years in 2008 (Pew Research Center, ACS)
- 8.9 years (1985): record-low median duration of marriage at divorce for opposite-sex couples in England and Wales (ONS)
- 6.1 / 2.4: provisional 2023 U.S. marriage and divorce rates per 1,000 population; rates measure how often, not how long (CDC/NCHS)
Contents
Part of the confusion is definitional. "How long does a marriage last?" sounds like one question, but the data answer two different ones. The first is the median duration of marriage at divorce, computed only among couples whose marriage ended in divorce: 13 years for men and 14 for women in the U.S. in 2024. The second is the median duration of current marriages (couples still married), which stood near 20 years in 2024. The two numbers describe different populations, and neither describes "marriage" as a whole.
The distinction matters because the two clocks tick differently. A divorce-based statistic can only describe marriages that have ended; it says nothing direct about the many marriages still in progress. The ~20-year figure for intact marriages, meanwhile, is a snapshot that grows as those couples accumulate years together. It is not a final length, because those marriages have not finished. Both figures are medians, meaning half of the relevant marriages fall above the number and half below. So when a headline says "the average marriage lasts X years," the useful questions are which marriages, measured how, in which year.
Two clocks: duration at divorce vs. length of all marriages
Ask how long the average marriage lasts and you will find two numbers that look like rivals but answer different questions. One clock stops when a divorce is finalized; the other keeps running inside marriages that are still intact. Confusing the two is the main reason "13 to 14 years" and "20 years" get quoted as if they contradict each other.
The first clock is duration at divorce. Using 2024 American Community Survey data, the National Center for Family and Marriage Research (NCFMR) at Bowling Green State University reports a median of 13 years for U.S. men and 14 years for U.S. women at their first divorce. Both figures have risen since 2008, when the median was 11 years for each sex.
The second clock is duration of current marriages. The Census Bureau's B12504 table, summarized by USAFacts, puts the median duration of still-intact U.S. marriages at 20 years as of 2024. That is a snapshot of marriages in progress, not a final tally.
The gap between the two clocks is mostly survivorship. Marriages that end in divorce leave the pool around year 13 or 14, while intact marriages keep accruing years, so a snapshot of the currently married overweights long-running unions. The 20-year figure tells you how long today's ongoing marriages have lasted so far, not how long the average marriage ultimately lasts.
| Metric | Value | Source |
|---|---|---|
| Median duration of first marriage at divorce, U.S. men, 2024 | 13 years | NCFMR / BGSU (ACS 2024) |
| Median duration of first marriage at divorce, U.S. women, 2024 | 14 years | NCFMR / BGSU (ACS 2024) |
| Median duration of current, still-intact U.S. marriages, 2024 | 20 years | USAFacts citing Census B12504 |
| Median length of U.S. marriages that end in divorce, 2023 | 12 years | Pew Research Center |
A third number often appears alongside these: Pew Research Center reports that the median length of marriages that end in divorce was 12 years in 2023, up from 10 years in 2008. That figure is related to the NCFMR medians but not identical to them. NCFMR isolates first marriages ending in a first divorce and reports separate medians by sex (13 years for both men and women in 2023), while Pew's number covers marriages that end in divorce regardless of marriage order and is not split by sex. Different samples and different definitions mean 12 years versus 13 to 14 years is not a contradiction; it is a different question being measured.
Each number is precise about exactly one question:
- 13 years for men, 14 for women (2024): how long a first marriage had lasted, at the median, when it ended in divorce.
- 20 years (2024): how long current, still-intact marriages had lasted so far, at the median.
- 12 years (Pew, 2023): how long marriages of any order had lasted, at the median, when they ended in divorce.
The U.S. trend over time
In 2008, the median first marriage that ended in divorce had lasted 11 years for both U.S. men and women. By 2024, that median had risen to 13 years for men and 14 years for women. The shift is modest on its own, but the direction is consistent: first marriages that end in divorce now last longer than they did a decade and a half ago.

The distribution behind the medians moved too. The interquartile range, the band holding the middle half of durations, widened from 15 years in 2008 to 17 years in 2024 for both males and females. The middle 50% of durations shifted toward longer marriages: from 5-20 years to 7-24 years among men, and from 6-21 years to 7-24 years among women. When both the median and the spread rise together, the change is broader than a few unusual cases.
The 2023 data offers a useful checkpoint. In that year, the median duration of marriage at first divorce was identical for men and women, at 13 years. The 2024 figures show a one-year gap between the sexes, so the difference is small and can shift with the sample from year to year.
| Metric | Value | Source |
|---|---|---|
| Median duration at first divorce, males, 2008 | 11 years | NCFMR / BGSU (ACS) |
| Median duration at first divorce, females, 2008 | 11 years | NCFMR / BGSU (ACS) |
| Median duration at first divorce, males, 2024 | 13 years | NCFMR / BGSU (ACS 2024) |
| Median duration at first divorce, females, 2024 | 14 years | NCFMR / BGSU (ACS 2024) |
| Median duration at first divorce, both sexes, 2023 | 13 years | NCFMR / BGSU (ACS 2023) |
| Interquartile range, both sexes, 2008 to 2024 | 15 to 17 years | NCFMR / BGSU (ACS 2024) |
| Middle 50% of durations, males, 2008 to 2024 | 5-20 to 7-24 years | NCFMR / BGSU (ACS 2024) |
| Middle 50% of durations, females, 2008 to 2024 | 6-21 to 7-24 years | NCFMR / BGSU (ACS 2024) |
What the spread tells us
No single number describes when a marriage ends. A middle half spanning 7 to 24 years means most divorces happen across a wide stretch of adult life, not at one predictable point. Reading a median as a target or a deadline (a marriage "should" last a certain number of years) helps no one. Divorce is a legal event, not a verdict on a relationship's worth, and long marriages end for the same ordinary reasons short ones do. If you want to understand how a specific partnership handles time and pressure, your patterns of attachment say more than any national statistic.
Differences across groups
Subgroups vary around the national medians. In 2024 among women, foreign-born Hispanics and non-Hispanic Asians had the longest median durations at first divorce, at 18 years, while native-born Hispanics had the shortest, at 11 years. These gaps reflect differences in marriage timing, immigration histories, and community norms, not differences in the value of the marriages themselves.
How the U.S. compares with peer countries
Peer countries publish numbers that look close to the U.S. figure, but only if you read the definitions closely. Some agencies report the median duration of marriage at divorce; others report marriage to separation; some give a mean instead of a median. These are not interchangeable, so every number below is labeled with what it actually measures.

England and Wales: 13.0 years at divorce
One note before the numbers: the ONS covers England and Wales only, not Scotland or Northern Ireland, so this is not a figure for the full UK. In 2025, opposite-sex couples divorcing had been married a median of 13.0 years, the longest since the time series began in 1963. That is a sharp reversal from the record low of 8.9 years in 1985.
Same-sex marriages show shorter durations in 2025: a median of 7.5 years for male couples and 6.6 years for female couples. In total, England and Wales recorded 105,002 divorces that year, from 102,879 opposite-sex couples and 2,123 same-sex couples.
Cohort tracking adds another angle. An estimated 16.3% of couples who married in 2015 had divorced before their 10th anniversary, down from 24.7% of couples who married in 1995. The two cohorts married a decade apart, and a smaller share of the later cohort divorced before its tenth anniversary.
Australia: 13.4 years to divorce, 9.4 to separation
The Australian Bureau of Statistics publishes two clocks, and the difference matters. In 2025, the median duration from marriage to divorce was 13.4 years, while the median from marriage to separation was 9.4 years. The gap between the two reflects couples who separate first and only later have the divorce finalized by a court.
Australia granted 49,158 divorces in 2025, up 4.1% from 47,216 in 2024. The crude divorce rate was 2.2 divorces per 1,000 people aged 16 and over, up from 2.1 the year before.
Canada: 12.8-year median, series ends in 2020
Statistics Canada's published series stops at 2020, so its figures are older than the others here. That year, the median duration of marriage at divorce was 12.8 years and the mean was 15.3 years. The mean runs higher than the median because long-tail marriages pull the average upward.
The longer view is clear: the mean rose from 12.5 years in 1980 to 15.3 in 2020. Marriages ending in divorce in Canada are lasting longer than they did four decades ago.

Where that leaves the comparison
| Country | Latest official figure | Data year | What it measures |
|---|---|---|---|
| United States | Median for men at first divorce (see the U.S. section above) | 2024 | Marriage to first divorce, men only |
| England and Wales (not the full UK) | 13.0 years | 2025 | Median duration of opposite-sex marriage at divorce |
| Australia | 13.4 years | 2025 | Median from marriage to divorce; 9.4 years from marriage to separation |
| Canada | 12.8 years median; 15.3 years mean | 2020 | Median and mean duration of marriage at divorce |
Across definitions, the peer countries land in the same neighborhood: medians near 13 years of marriage at divorce in England and Wales, Australia, and Canada, with Canada's mean sitting higher. Which one you set the U.S. figure against changes the comparison, because a U.S. median for men at first divorce is not the same measure as Australia's marriage-to-divorce median. Definitions move these numbers by a couple of years; they do not change the overall story.
If one of these timelines matches your own, the length of a marriage says nothing about what comes next. For the part after the paperwork, see our guide to how to get over a breakup.
The eight-year myth
Ask a search engine for the average length of marriage and one number keeps surfacing: eight years. The figure persists because it is easy to repeat, not because it is current. Its most traceable root is genuine but old: the ONS recorded a median duration at divorce of 8.9 years for opposite-sex couples in England and Wales in 1985, a record low. The same bulletin notes the long-term trend since then has been marriages lasting longer before divorce, with the median rising from that 1985 low, which is what the current medians cited earlier in this post show.
Why divorce rates are not marriage duration
The CDC's FastStats page reports provisional 2023 figures for the United States: a marriage rate of 6.1 per 1,000 population and a divorce rate of 2.4 per 1,000. These are incidence rates, meaning events counted per 1,000 people in a single year. They measure how often marriages and divorces occur, not how long marriages last. A rate can hold steady while durations rise or fall, because duration is a separate statistic computed only from marriages that actually ended.
| U.S. metric, provisional 2023 | Value |
|---|---|
| Number of marriages | 2,041,926 |
| Marriage rate | 6.1 per 1,000 population |
| Number of divorces (45 reporting states and D.C.) | 672,502 |
| Divorce rate (45 reporting states and D.C.) | 2.4 per 1,000 population |
Source: CDC/NCHS FastStats, provisional 2023 data.
Two cautions follow directly from the table. The divorce count covers only 45 reporting states and D.C., so it is not a complete national total. And none of these four numbers describes duration; for that you need median duration at divorce, which comes from a different calculation entirely.
Methodology and sources
We built this post from primary statistical sources: the ONS for England and Wales and CDC/NCHS for the United States, checking every figure against the original publication rather than a summary. While comparing measures, we also reviewed material from the Australian Bureau of Statistics (ABS), Statistics Canada, the National Center for Family and Marriage Research (NCFMR), Pew Research Center, and USAFacts. We opened and verified every cited source manually on 9 November 2026, and the cited data years span 1985 to 2023.
The limitations are real, and we would rather name them than smooth them over. Median duration at divorce describes only marriages that ended in divorce in a given year; it excludes marriages still intact and those ended by a spouse's death.
The ABS measures duration on two different clocks, so we present its figures separately instead of blending them. Statistics Canada's divorce series ends in 2020, so Canadian figures lag the rest. NCFMR tracks duration to first divorce, while Pew's widely shared figures cover all divorces, and the two are not directly comparable. USAFacts numbers trace to Census table B12504, which is not a duration-at-divorce series.
We review this page annually and refresh it when the ONS, CDC/NCHS, ABS, or Statistics Canada publish new figures. If reading statistics stirs worry about your own marriage, that is a common response, and it often says more about anxious attachment than about the numbers themselves.
Common questions
What is the average length of a marriage in the US?
There is no single average. Among first marriages that end in divorce, the 2024 ACS median was 13 years for men and 14 for women (NCFMR). Current still-intact marriages have a median duration around 20 years (Census B12504 via USAFacts, 2024). The viral "8 years" figure does not match these official medians.
Is the average marriage really only 8 years?
Not in current official medians. England and Wales hit a record-low median of 8.9 years at divorce in 1985 (ONS), and many U.S. listicles still quote about 8 years. By 2024-2025, U.S. first-divorce medians are about 13-14 years, the ONS opposite-sex median is 13.0 years, and the ABS marriage-to-divorce median is 13.4 years.
How long do marriages last in the UK?
For opposite-sex couples in England and Wales, the median duration of marriage at divorce was 13.0 years in 2025, the longest since the ONS began the series in 1963. Same-sex marriage medians at divorce were shorter (7.5 years for male couples and 6.6 for female couples), partly because same-sex marriage only began in 2014.
How long do marriages last in Australia before divorce?
In 2025 the ABS median from marriage to divorce was 13.4 years. The median from marriage to separation was 9.4 years. Those are different clocks: many couples separate years before the divorce order, and Australia requires at least 12 months of separation before a divorce can be granted.
What about Canada?
Statistics Canada's published divorce-indicator table shows a median duration of marriage at divorce of 12.8 years in 2020 and a mean of 15.3 years. That series, in table 39-10-0051-01 as downloaded for this page, currently ends in 2020, so treat Canada as the oldest peer figure in the set.
Why do sources disagree on the number?
They measure different populations. Duration at divorce ignores intact marriages, while current-marriage medians include couples still together and sit near 20 years in the U.S. First-divorce samples differ from all divorces, and means and medians also diverge because long marriages pull the mean up. Always read the definition before comparing countries.
Sources
- National Center for Family & Marriage Research, Bowling Green State University, Duration of Marriage at First Divorce, 2008-2024 (FP-26-15), accessed 9 November 2026.
- Office for National Statistics, Divorces and dissolutions in England and Wales: 2024 and 2025, accessed 9 November 2026.
- Australian Bureau of Statistics, Marriages and Divorces, Australia, 2025, accessed 9 November 2026.
- Statistics Canada, Number of divorces and divorce indicators (table 39-10-0051-01), accessed 9 November 2026.
- Centers for Disease Control and Prevention, FastStats: Marriage and Divorce, accessed 9 November 2026.
- Pew Research Center, 8 facts about divorce in the United States, accessed 9 November 2026.
- USAFacts, How does marriage vary by state?, accessed 9 November 2026.
- National Center for Family & Marriage Research, Duration of Marriage at First Divorce, 2023 (FP-25-22), accessed 9 November 2026.
- Statistics Canada, A fifty-year look at divorces in Canada, 1970 to 2020, accessed 9 November 2026.
If one of these numbers lands hard because you are living through it, that is a reasonable reaction, and talking it through with someone can help. If you want a private place to start, WiseLove offers an AI relationship coach you can use at your own pace, and the WiseLove journal is a quiet space to sort out what you are feeling before deciding anything.
Figures last verified 9 November 2026.
Talk it through with WiseLove
An AI relationship coach that remembers your situation, available any time. $7.50/month, no waiting room.

Related reading
Gray divorce statistics 2026: couples over 50
Gray divorce statistics for married couples over 50: US rates since 1970, the 38% share of all divorces, marriage length and UK and Australia data.
Single parents statistics 2026 (US Census data)
25.6% of US children live with one parent (Census 2025). Single mothers vs fathers, poverty, state rankings and UK, Ireland, Canada data, fully sourced.
Dating app statistics 2026 (US, UK)
30% of US adults have used a dating site or app (Pew). Tinder vs Hinge paying users in Q3 2026, safety data and UK figures, fully sourced.